3D documentation of engineering networks by mobile phone
Read

Hranice and Jezernice viaducts

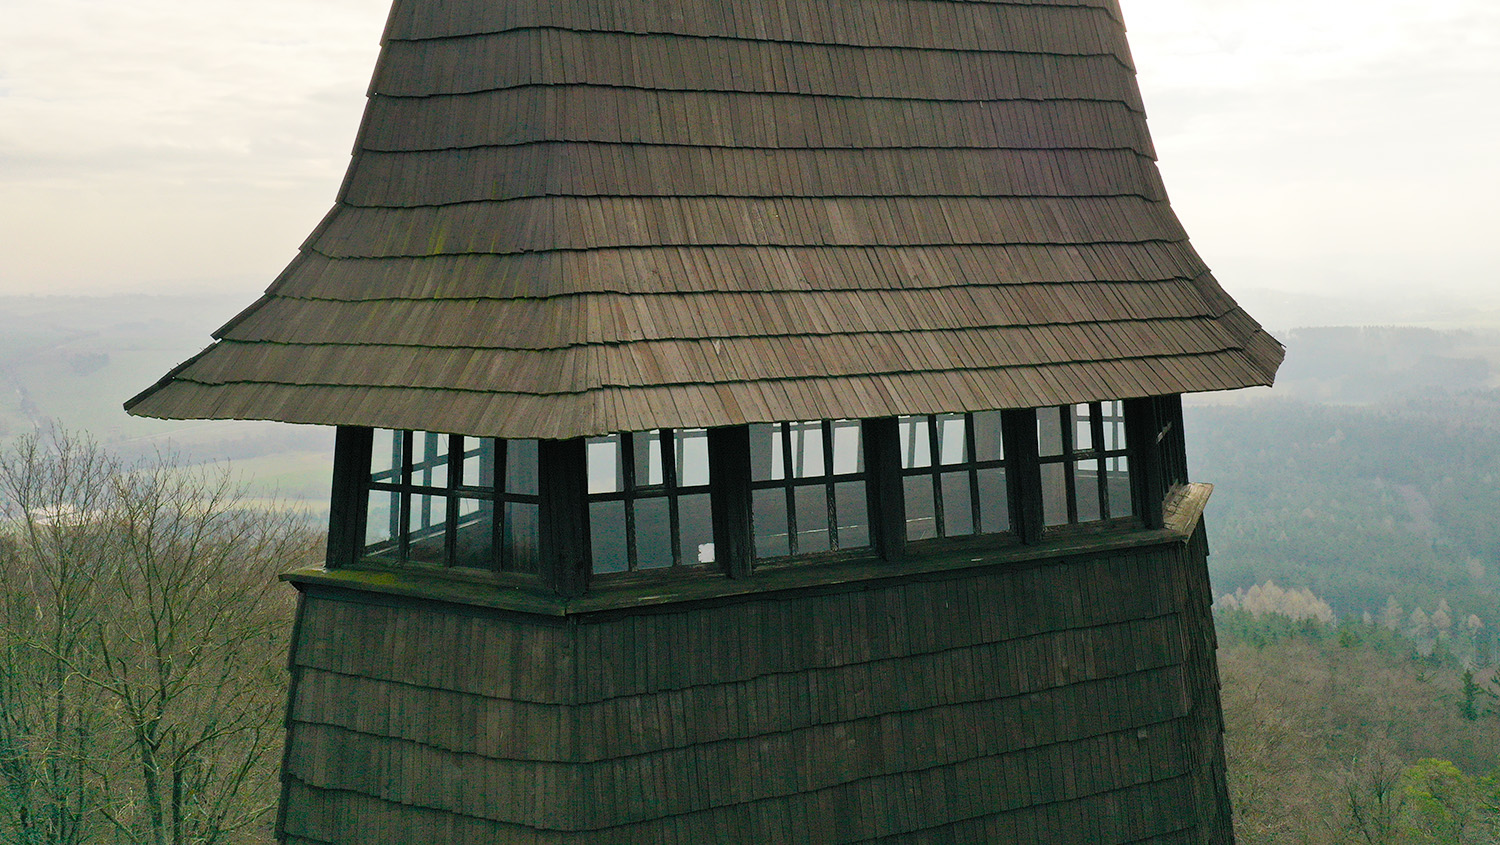
We have created 3D visualizations of historical buildings.

The Přerov–Bohumín railway line, now also known as line 271, was an important transport structure as early as in the 19th century. It was then that these beautiful period viaducts (Hranice and Jezernice) were built on it, later to be declared a Czech cultural heritage site in 2007. The route between Lipník nad Bečvou and Přerov was originally a single-track line. In the mid-20th century, work began to convert it into a two-track line, and it is now fully electrified. It forms part of ‘transit railway corridor II’, which is the main long-distance railway route between Břeclav and Petrovice u Karviné.

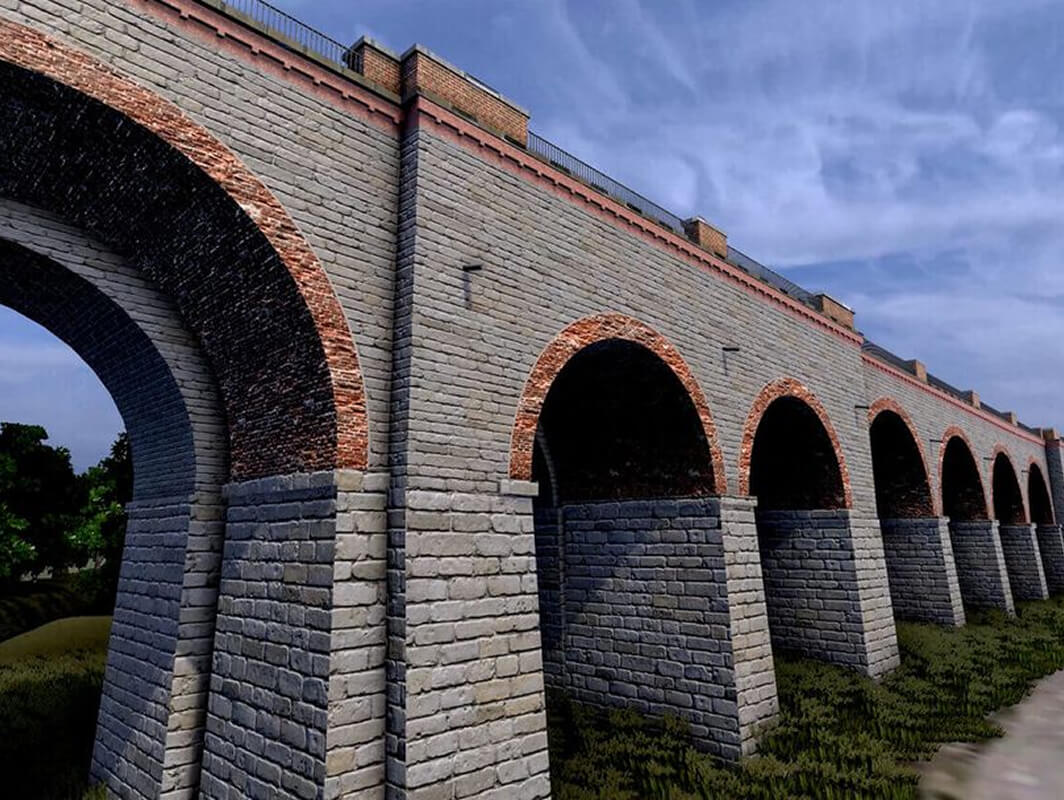
The Jezernice viaduct consists of two originally brick bridges that were built next to one another. It rises above the valley of the Jezernice stream between the Lipník nad Bečvou and Drahotuše stops and is less than 427 m long.

The Hranice viaducts is the name for the three parallel railway bridges that span the Velička River near the Hranice na Moravě railway station. The viaduct has 32 brick arches and is a total of 448.5 m long. The first two brick structures are connected by concrete slabs. The third structure, i.e. the concrete bridge, is connected to them by a footbridge at the gaps.

Creation of 3D Model

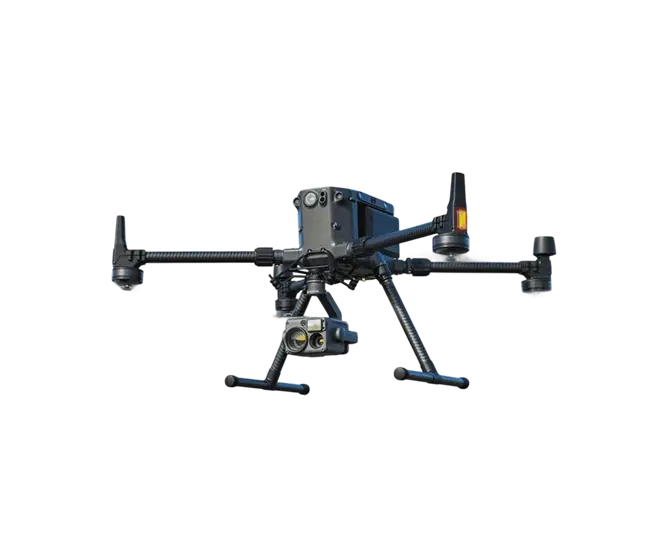
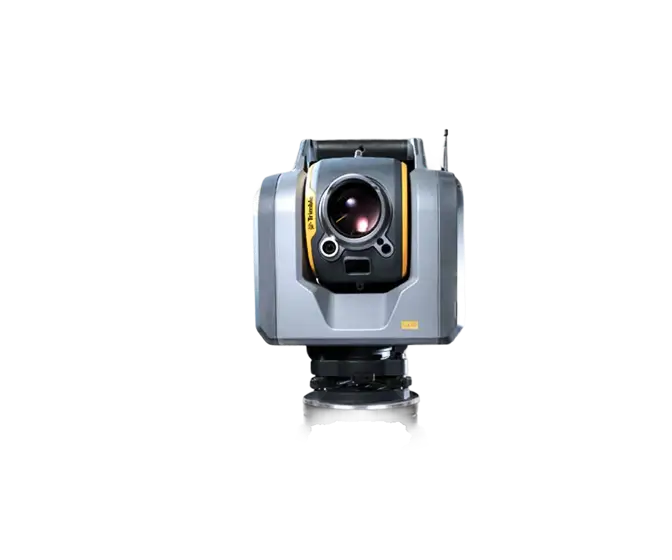
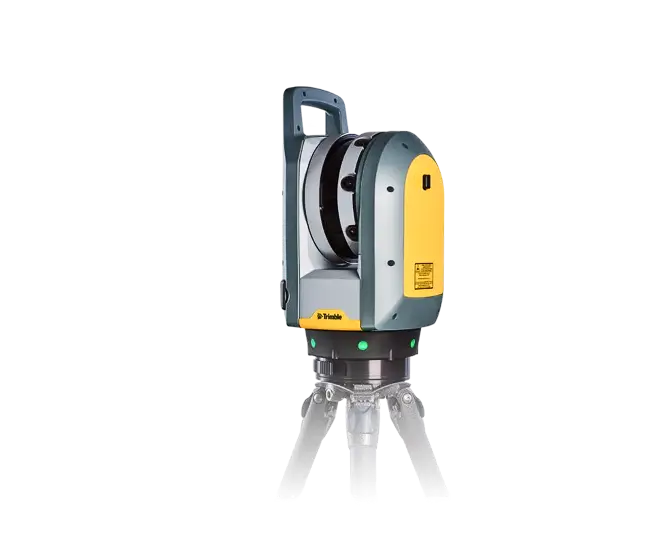
Both viaducts were first surveyed from above. The Jezernice viaduct was surveyed by a DJI Matrice M300 drone equipped with a DJI P1 35 mm camera. A DJI Phantom 4 PRO drone was used for the Hranice viaduct. Both viaducts were then surveyed on the ground – using Trimble X7 and Trimble SX10 laser scanners (we also tested the Trimble X12 as part of the project). Combining these devices gave us a highly accurate and detailed survey of the two viaducts. Point clouds were created from the resulting data and then vectorized as a 3D model.

Objectives and Benefits

Our aim was to collect 3D data and create a 3D visualization of the viaducts using drones and point clouds with the required accuracy and density. We did this using a Trimble SX10 combined scanner and total station. A Trimble X7 scanner was also used during the measurement, to perform a detailed scan. This method ensures highly accurate data and sufficient resulting cloud density to create the 3D model.

Advantages of object scanning

  • High precision object surveying
  • Finding detailed properties and general geometry of objects
  • High speed and determination of results when needed
  • Detailed survey
  • High quality output even in low light conditions
  • Ability to measure individual elements

Visualization – detailed information

We additionally created a 3D visualization using a game engine, i.e. a software framework that concentrates the general functions used in computer games. The functionality of the application was programmed in the C# language and converted to the WebGL standard to enable it to be run in a web interface. The application is multi-platform and programmed so that each user can set the graphics detail to suit their computer performance and individually adjust user settings (mouse sensitivity, etc.). The application was also created both for desktop computers and for the aforementioned web environment. Game development standards were followed during the development of the application.

Objectives and benefits – visualization

3D visualization gives one a far clearer picture. This is important when planning new buildings or expanding or reconstructing existing ones, and in similar projects. The three-dimensional display and detailed modelling provide a more realistic view of the future result.

Another option for capturing 3D visualizations is to use a ‘digital vault’. The buildings in question have a certain historical value, and 3D visualizations and applications can portray how they looked at a certain point in time. This digital record can be used for the purposes of reconstruction, documentation or heritage conservation.

The third way of working with visualizations is their role as a guide. Being photorealistic, they are an effective means of providing guides and instructional material in various fields (they can, for example, promote tourism in a certain place, etc.).

Advantages of visualization

  • Offers a better picture and a basis for more effective planning
  • Photorealistic impression, enabling animation of the movement of vegetation and other elements
  • Captures a structure’s appearance at a point in time as a digital vault
  • Serves as the basis for a possible instructional tool
Technologies used

DJI Phantom 4 Pro

We use this drone mainly for more precise and less extensive work, or for vertical mapping. It is equipped with a high quality 20 megapixel camera with the ability to record 4K videos.

DJI Matrice 300 RTK Drone

This professional heavy-duty drone can hang up to 3 devices and has several intelligent modes for search, surveillance and targeting missions. The flight time is almost 1 hour.

Trimble SX10

The Scanning Total Station is an innovative solution in mapping, engineering and geodesy worldwide, thus setting new standards for geodetic instruments.

Trimble X7

The high-speed scanning station is the latest innovative mapping, engineering and geodesy solution that provides data visualization in the field. The basis is fully integrated 3D scanning functions. Allows you to export data to standard point cloud formats.

Contact us

Not sure which service is right for you?
Ask our experts.
Thank you
Your data request has been successfully sent!
We will contact you soon.
Something went wrong, please try again.
Ing. Miroslava Kubíčková
Expert consultant in the field of mapping, LiDAR, photogrammetry, UAV/UAS, 3D models, and BIM